How to mitigate the “rush hour effect” using Supply Chain Tools
Alejandro Serrano – . Apr 19, 2012 | Spain
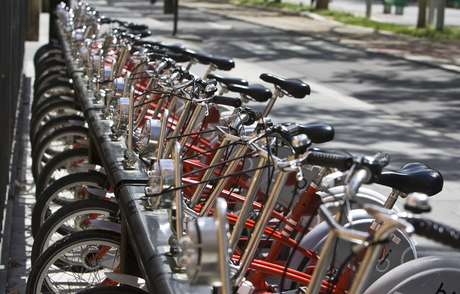
Bizi-Zaragoza rents bikes to users who need to ride for short periods of time within the city. Bikes are located in 130+ stations in the city, mainly downtown. To get a bike, a user goes to a station and unlock the desired bike with his or her user card. To return it, he or she has to find a station with an empty slot and identify him or herself again.

Bizi Station. Source: http://www.heraldo.es
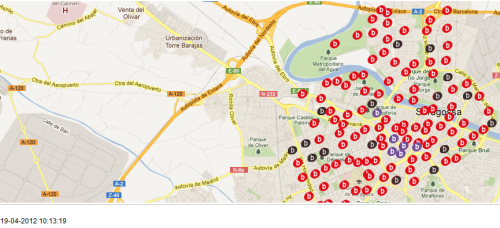
The idea is very interesting, and has been proved successful in several cities. The system in place, however, is far from perfect, since users face two major challenges. On the one hand, a user looking for a bike may find the nearest station empty (see black dots in the picture below). On the other hand, a user looking for a slot to leave a bike may find the nearest station full (see purple dots). Furthermore, stations downtown tend to fill quickly in the morning and empty in the afternoon/evening. Good on-line information may be helpful to find a bike or a spot, but still the bottom line is that the typical user my find the service unreliable when his meeting with her boss starts at 9am, and he has to plan for extra 20 minutes of safety time to park his bike so as not to be late.
To mitigate this situation, and according to today’s Heraldo de Aragón(*), a local newspaper, Bizi managers constantly check on-line those stations with no bikes, and send vans with additional bikes to “replenish” those empty stations in no more than 10 minutes. Here is some anecdotal evidence that this may not be the case. The following picture (borrowed from the company web site) shows the map of all stations at 10:02:45 am today. There were 13 empty stations (marked in black in the map), mainly in the periphery.
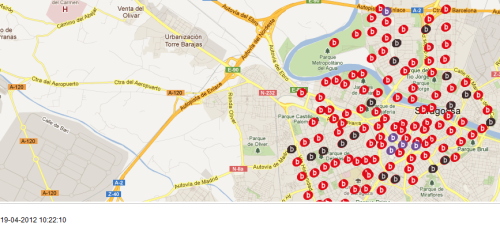
Ten minutes later, the picture was the following
As it can be observed, 12 of those 13 stations were still empty. Twenty minutes later, there was a new picture.
In this case, 8 of 13 stations were still empty. Thirty minutes later (picture not reported) still 8 of 13 stations were still empty. A similar problem can be observed with full stations (purple dots in the maps).
The question that arises next is how to mitigate this problem. A feasible option is to place stock (i.e. bikes) according to demand patterns to obtain a given service level. For instance, let us say that for the last 50 Mondays, between 7:30 am and 9:00 am, station#77 has observed a demand pattern that can be considered normally distributed, with mean 10 and standard deviation 2 (that implies that roughly 2/3 of the days demand is between 8 and 12 bikes). How many bikes are needed to guarantee an average service level of, say, 99%? The answer is
ROUNDUP(10+2*NORMSINV(0.99),0)=15 bikes
Therefore, rather that being reactive, Bizi managers could be proactive by replenishing inventory at night before users go to work early in the morning. The previous analysis is quite simple and can be easily extended for all stations and for full stations. The good news is that the company should have a lot of data, given that users sign in every time they take or leave a bike. To improve forecasting methods, individual patterns can be studied, since the system knows the ID of the user that takes or leaves a bike.
Finally, there is the problem of devoting workforce to move bikes from one station to the other. A potential solution may be to charge more to those users who do not make “return trips” within a day. If so, users have incentives to return bikes to where they were in the evening, significantly reducing the amount of bikes to be moved at night.
To know more about Supply Chain www.zlc.edu.es
(*) The piece of news is here (in Spanish)
The web page of Bizi Zaragoza is here


