Tag Archives: distribution

To centralize or not to centralize, that is the question

How much safety stock to hold? A ubiquitous question in supply chain network design

Alejandro Serrano –  Apr 2012 | Spain

When a firm designs from scratch its distribution network, a repetitive question arises sooner or later: should we have a centralized or a decentralized network? In a pure centralized network, a large, central distribution center (CDC) contains all the finished-good inventory of the company. In a pure decentralized setting, inventory for each SKU is splitted among several smaller regional distribution centers (RDC).

One of the key questions mangers usually struggle with when deciding about centralizing inventories or not is how many units of each SKU should be held in each case. It is a relevant question, because holding inventory usually entails significant holding costs, both financial and material.

Let us learn the basics of how to answer that question by means of a very simple example: Assume that the demand of a typical product in the portfolio in a stable market is normally distributed, with mean 400 units/period and standard deviation 80 units/period. The market is divided into four identical regions with independent demand. The firm service level target is 95%, thus in the (assumed current) CDC there should be 532 units to maximize expected profit:

(If it is not clear to you why this formula is used, please bear with me; it will be explained in a subsequent post)

Now consider that your company is planning to change its distribution strategy from centralized to decentralized, and so you consider having  four identical RDCs, one per region. The average demand in any region will be 1/4 of total demand, or 400 / 4 = 100 units. The regional variance will be 1/4 of total variance (assuming demand independence across regions), thus the standard deviation in any region will be

The quantity per RDC is

The total inventory is 166 x 4 = 633 units. The safety stock needed, i.e., the amount of inventory to hold above the average demand is 532 – 400 = 131.5 units in the centralized case and 633 – 400 = 263 units in the decentralized case. Interestingly, the latter quantity is exactly two times the former. It is not a coincidence that 2 is the squared root of 4. In fact, when switching from 1 to n DCs, overall safety stock is multiplied by √n. For instance, had we considered 9 RDCs, total inventory to hold would have been 400 + 3 x 131.5 = 795 units.

Of course there may be more involved scenarios (e.g. constraints or demand correlations across regions) that modify the optimal solution. However, keeping in mind this simple square-root formula as a rule of thumb for safety stock will help make back-of-the envelope calculations when quick business decisions have to be made.

To know more about Supply Chain www.zlc.edu.es

4 Comments

Filed under Education, Supply Chain

Adidas to cut its assortment by 25%

How many SKUs should a firm offer?

Alejandro Serrano – . Apr 2012 | Spain

Herbert Hainer, CEO of Adidas AG, announced last Saturday* that the company has plans to cut 25% of its 46,897 SKUs. An argument used by Mr. Hainer to justify their decision is that 20% of the current assortment generates 80% of sales.

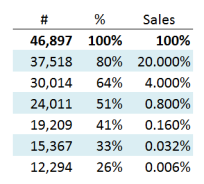
If this roughly is the case–which should not be surprising, according to Pareto’s law, it means that 80% of the assortment accounts for 20% of sales. And most likely, within the remaining 80% SKUs, Pareto’s law still holds, i.e., 80% of that 80% account for 20% of the remaining 20% of sales, and so on and so for. Working in this fashion we can prepare the following table for how much the SKUs with the least sales sell.

How much SKUs with the least seales sell according to Pareto's Law

As the last row shows, cutting SKUs by 25% means removing those items that contribute to 0.006% of sales, or $1.2m, since Adidas sells roughly $18b. Remarkably, those 12,294 items  only sell $83 (roughly 1 unit) on average worldwide! Therefore, it makes a lot of sense to remove them from the assortment.

The natural question to ask at this point is why pruning 25% of the items and not more. Should Adidas also remove the second-to-last row items (15,367 SKUs!), which sell $400 on average worldwide? What about the third-to-last row?

These question nicely illustrates the usual trade-off between Marketing and Supply Chain departments in the retailing industry. A marketing-driven organization, like Adidas, argues that adding an SKU to the assortment increases sales. The more variety offered, the higher the chances that the customer likes whatever is on the shelf thus the probability of making one additional sale. The penalty to pay is in the form of, mainly, inventory holding cost and ordering cost. In good times (Adidas increased sales by 10% last year) this penalty tends to be underestimated.

Indeed there is no clear answer to the question posed above, but we can have a look at other industries to shed some light on the issue. For instance, in the telecommunication telephone manufacturing industry,  Apple sells only 2 SKUs (i-phone 4, either black or white), whilst Nokia sells at least one model for each market segment (for instance, it sells 37 different models only in Germany). Other successful companies have followed the same trend of reducing the number of SKUs to focus on reducing supply chain costs. Good examples include Lidl in Germany or Mercadona in Spain.

A holistic view of the company is necessary to make sound decisions when answering the question of ow many SKUs in the assortment are needed. Supply chain costs should be carefully pondered before blindly following the advice of marketing experts.

(*) Frankfurter Allgemeine Zeitung. The link to the piece of news is here  (in German)

 To know more about Supply Chain www.zlc.edu.es

2 Comments

Filed under Uncategorized

Zaragoza vs Madrid, where to place a Distribution Center in Spain?

Why Zaragoza is a better location than Madrid to place a Distribution Center

Alejandro Serrano

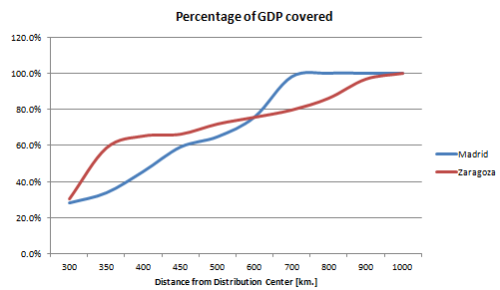
If your firm is looking for a location to place a distribution center in Spain, Madrid looks like a natural choice. It is on the centroid of Spain, and is very well communicated by truck with all the Spanish regions, given the radial structure of the Spanish route network. Indeed, Madrid can be considered as the center of gravity of the Spanish GDP. When compared to Zaragoza, Madrid is closer to the average customer (as weighted by GDP) by 56 km (own calculation).

Source: own calculation

However, average distance should not be the key criterion when making such a decision, total cost  should be used instead. Total cost can be split into three main portions: inbound logistics (from suppliers to the DC,) warehousing (cost of running the DC,) and outbound logistics (from DC to customers.)

As for inbound logistics, the actual cost for each alternative will depend on the transportation mode. If goods come by ship, Zaragoza is closer than Madrid to Bilbao, Barcelona, and Valencia ports, and moving containers to the DC by either truck or train will be in general cheaper. If goods come by truck from Europe, distance to Zaragoza will be shorter by roughly 300 km., what represents about 300 € per truck.

As for outbound logistics, Zaragoza is more expensive as noted, but not that much; 56 additional kilometers may represent around 50 € per truck, according to the CEO of a well-known transportation company in Spain.

Although these two portions may seem important at first sight, they become almost irrelevant when compared to the cost of running the DC. Running a DC implies paying workers payroll and space rental. Salaries in Zaragoza are, on average, 17% cheaper than in Madrid (source: INE 2011); Logistics space in Madrid strongly depends on the distance to the city center (there are up to four rings in Madrid with large price differences,) but specialists who give data of both Madrid and Zaragoza show that the latter is clearly cheaper than the former (by an average of almost 50%)

Considering the cost break-down presented, a basic analysis for a standard DC yields the following graph

Drivers assumed normally distributed with standard deviations being either 10 or 20% of the mean

where it can be noted that Zaragoza is always a better option than Madrid.

Finally, a sensitivity analysis shows that only labor and rent costs are relevant, with the number of workers and rent unit cost being the main drivers, and equally important (both in favor of Zaragoza.)

In sum, cheaper labor and space rental clearly outweighs the longer average distance from Zaragoza to customers, which makes Zaragoza, by and large, a more appropriate location than Madrid area for setting a distribution center.

Learn more about Supply Chain Management at www.zlc.edu.es

1 Comment

Filed under Supply Chain